Work / EDGE Industries
A twin for the grid
- Role
- Founding designer, Head of Design, 2024 to now
- Team
- Design, engineering, domain experts
- Methods
- Stakeholder workshops, domain research, journey mapping, rapid prototyping
- Outputs
- Grid operations dashboard, digital twin views, design system
EDGE Electra is an AI-powered grid operating system for how India’s electricity reaches homes, farms and factories. It builds a living digital twin of the grid and turns it into intelligence for operations, planning and clean energy.
A quick primer on the grid
If you’ve never thought about where your electricity comes from, here’s the short version.
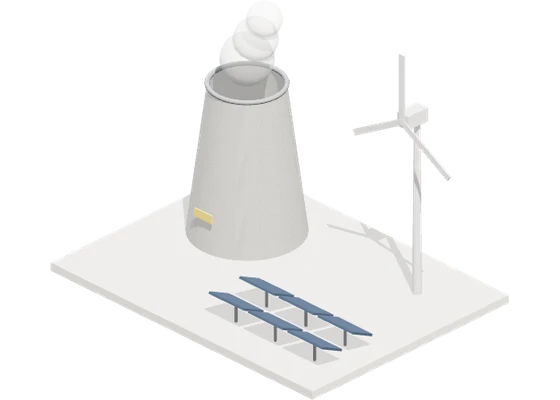
Generation companies make power in plants, solar and wind farms.
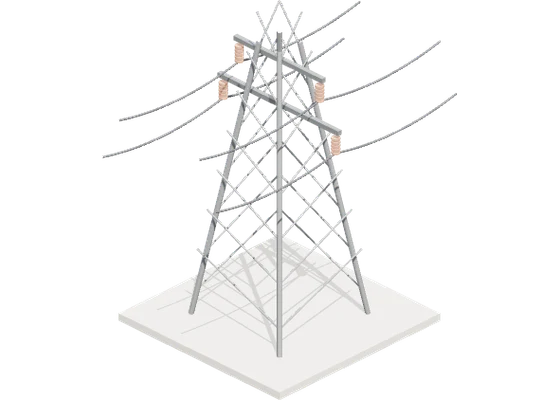
Transmission companies carry it across states on high-voltage lines.
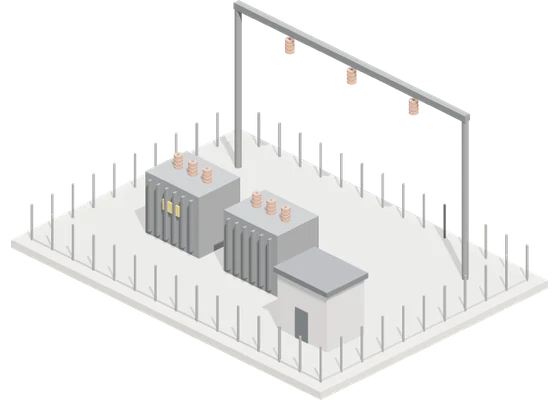
Distribution companies bring it down to your street.
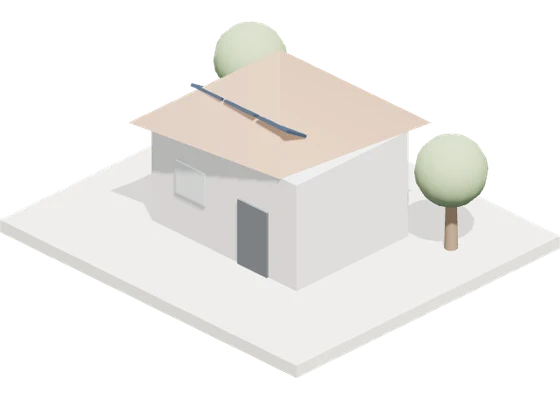
Homes, farms, shops and factories use it.
A DISCOM, or distribution company, runs that last step: the wires, poles, transformers, bills and faults. India has dozens, serving hundreds of millions of people. Electra is built for them.
What’s actually out there
A DISCOM looks after millions of assets across cities and villages. Electra maps them one by one.
Step high voltage down for a city or district.
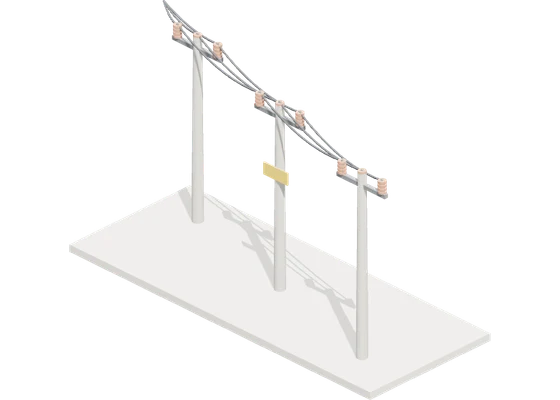
Main lines carrying power to a neighbourhood.
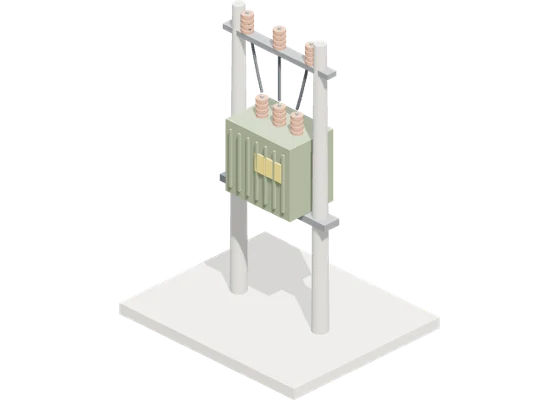
Lower the voltage again, safe for homes.
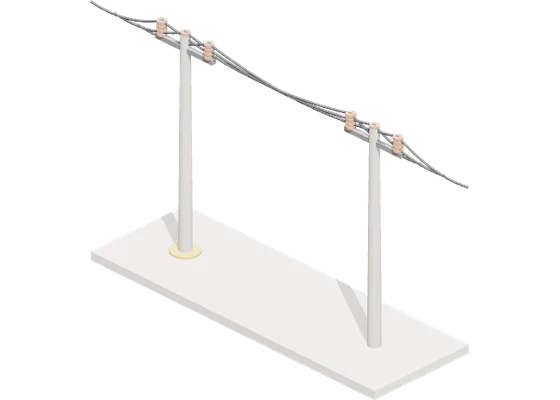
Millions of them, down every street.
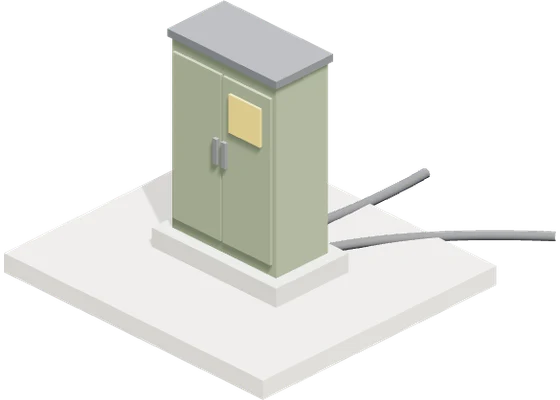
Street cabinets that split power to buildings.
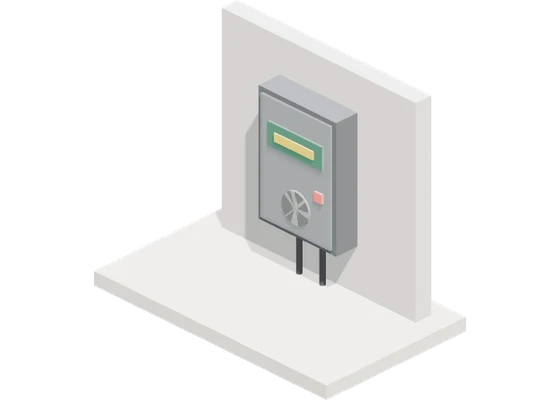
On every home, measuring what is used and billed.
Why solar makes it harder
The grid was built for one-way power. Now farmers add solar under PM KUSUM and homes add rooftop panels under PM Surya Ghar, so power flows both ways with the sun.
That only helps if the DISCOM can see where the solar is and how much the lines can take.
The problem
India wants more renewables and more reliable power, but most DISCOMs can’t see their own grid. Assets live on paper, data sits in dozens of systems and field teams work from memory.
Our first utility, JVVNL, lost about $75.9M on $3.1B of revenue in FY 2024-25, and must grow solar and wind from 17% to 44% by 2030.
Consumer connections
Profit after tax
Solar and wind, today to 2030
The users we were designing for
From the lineman on a pole to the leaders running the utility, each needed something different from the same grid.
Fixes faults, checks theft and connects new homes on the ground.
Junior Engineer. Assigns daily work to linemen in a section.
Assistant Engineer. Oversees a sub-division and its JENs.
Executive Engineer. Runs a division and tracks its targets.
Circle and DISCOM heads. See revenue, losses and progress.
Four layers, from the field to the control room
Electra works in four layers, each building on the one below.
04Everyday workflows that engineers and field teams use to run the grid.
03Data turned into insight for operations, reliability and planning.
02Every utility system in one place, for a real-time view.
01A living map of every asset, mapped on foot and by drone.
- 01 DigitizationA living map of every asset, mapped on foot and by drone.
- 02 IntegrationEvery utility system in one place, for a real-time view.
- 03 IntelligenceData turned into insight for operations, reliability and planning.
- 04 ImplementationEveryday workflows that engineers and field teams use to run the grid.
The product suite
Electra is a suite of four products in three stages, each shaped around its users and all on one map and design system.
Digitise
Run by EDGE's own operations team to build the twin.
Analyse
For engineers and managers running the network from the office.
Act
For DISCOM employees out in the field: JENs, AENs and linemen.
01 · Digitise the grid
A digital twin is a live map of every asset and how it connects. Most DISCOMs had theirs on paper, so our operations team built it.
Ground Mapper, on foot
Mappers walk up to each asset and capture its location, details and connections. It works well in towns, but in rural Rajasthan walking to every pole wasn’t always possible.
Drone Mapper, from the air
An operator plays back drone footage, spots each pole, pins it and fills in its details, all from a desk.
What we mapped
We digitised the whole network into one accurate system of record. It became the base for analytics, live monitoring and decisions across the utility.
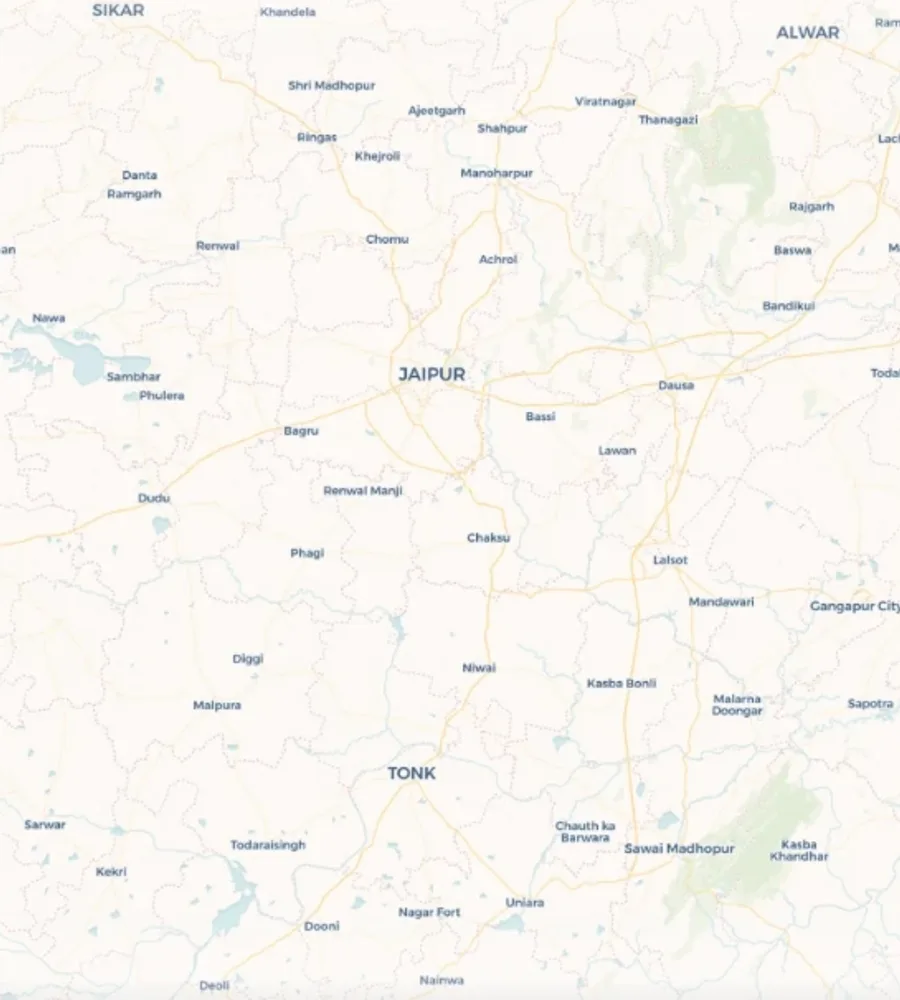
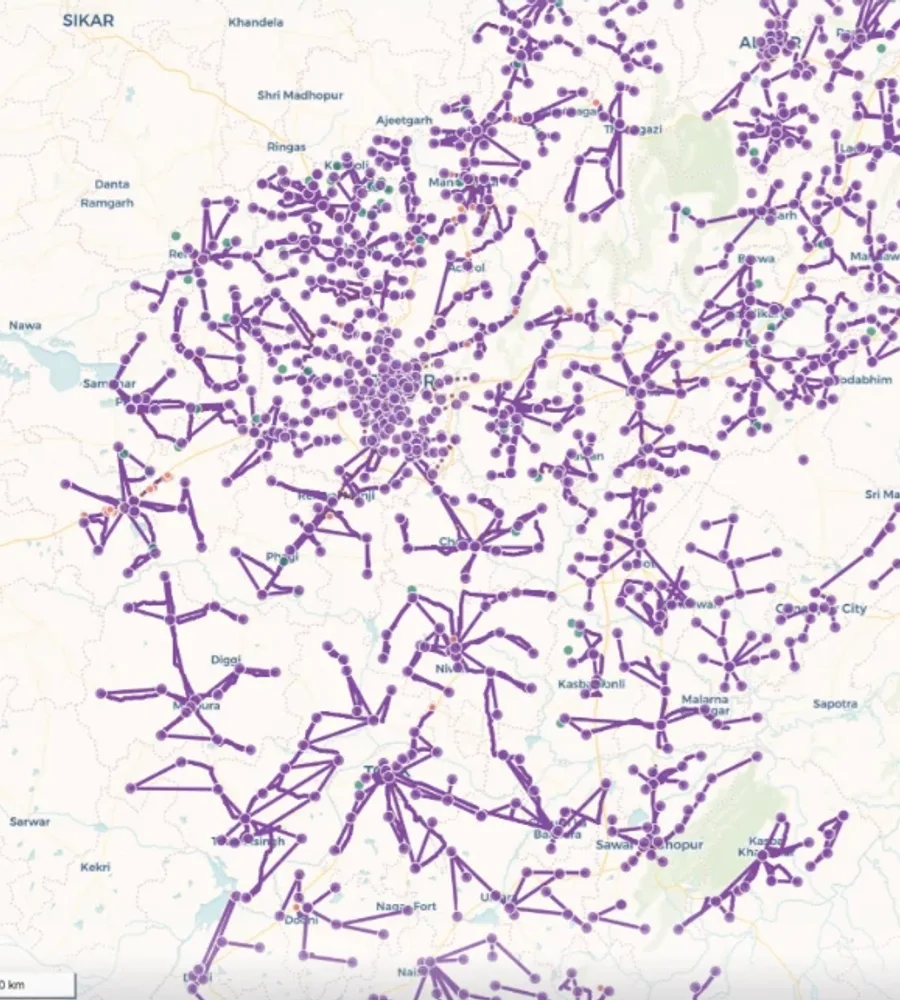
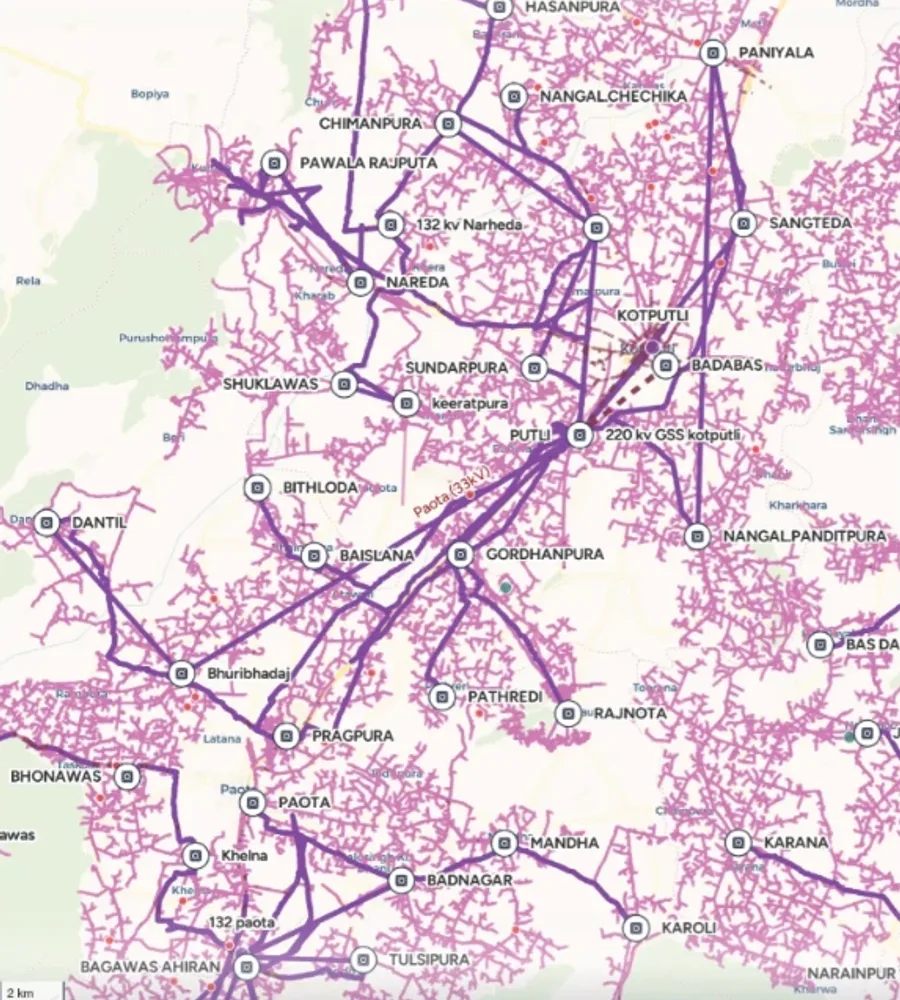
The video at the top is Kotputli Circle in JVVNL: about 1 million people, 50,000 transformers and 128 substations, mapped down to every pole.
02 · Analyse in the control room
Electra Web
Engineers and managers run the mapped grid from Electra Web, with assets, live visibility and analysis in one place.
Zoomable GIS with layers for assets and sensors.
Live feeder readings to spot outages and overloads.
Load flow on the map to balance load and cut losses.
Simulate demand and new infrastructure first.
Losses, risk, forecasts and collection by area.
Digital diagrams in a few clicks.
One trusted library of every grid asset.
Ask in plain words, get a table, chart or map.
People, offices and role-based access.
Load flow analysis
Flow mode simulates how power moves, so operators can spot overloads and rebalance load before the grid fails. Each substation shows how much load comes from rooftop solar (DRE) versus the grid.
Demand forecasting
A DISCOM must forecast its draw in 15-minute slots and pays penalties when wrong. Electra’s AI predicts demand and tracks it slot by slot.
Single line diagrams: a canvas for electrical engineers
Think of a Figma board for electrical engineers. Instead of paper drawings that date instantly, they drag in substations, feeders and transformers, and the diagram stays tied to real assets.
03 · Act in the field
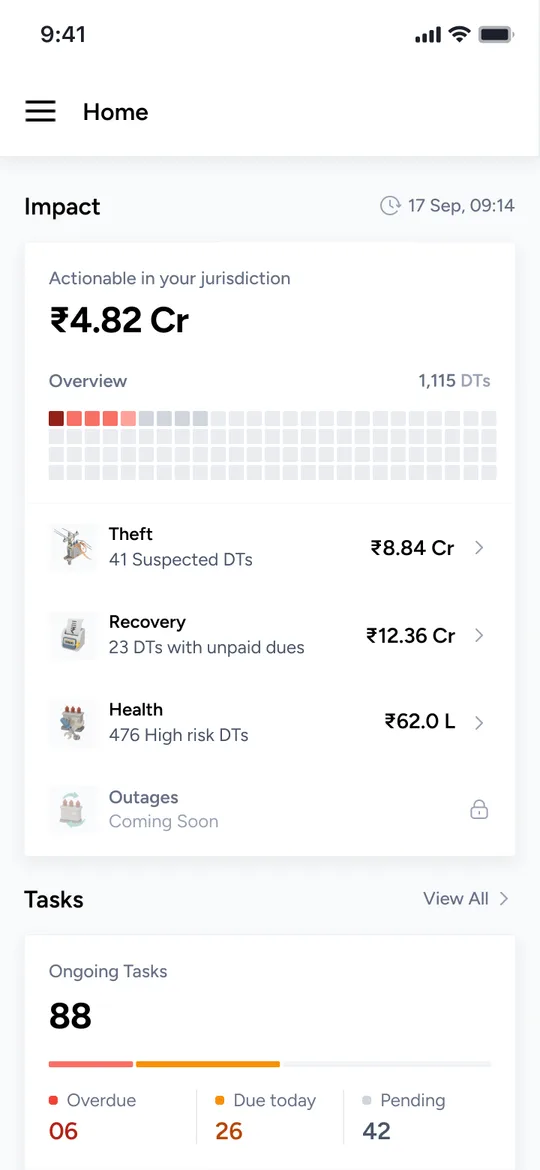
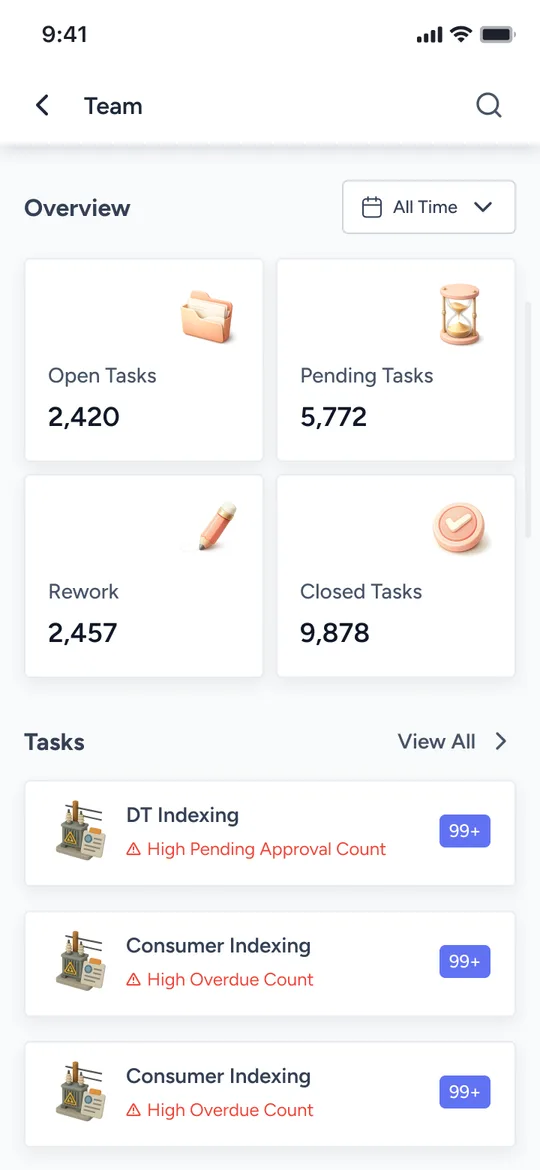
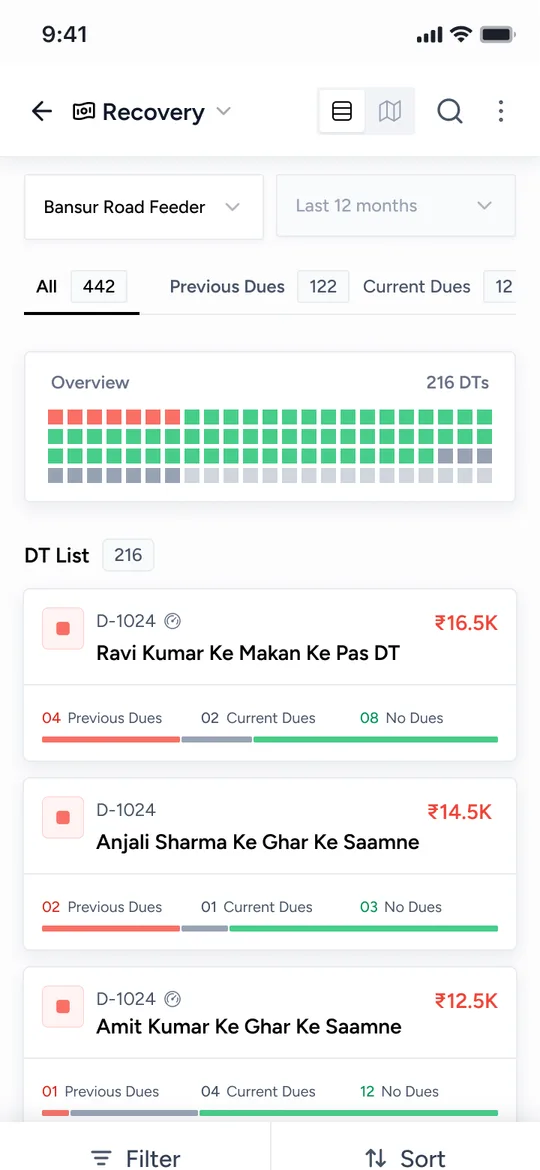
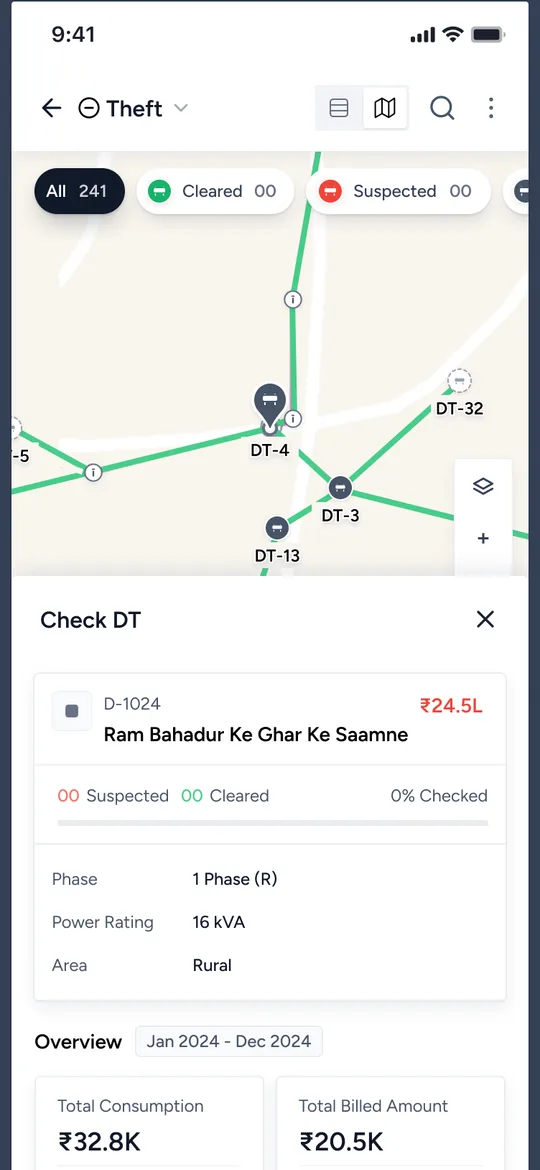
Electra Mobile
Linemen, JENs and AENs open Electra Mobile every morning. For many it’s their first work app, so it uses plain words, big numbers and simple steps.
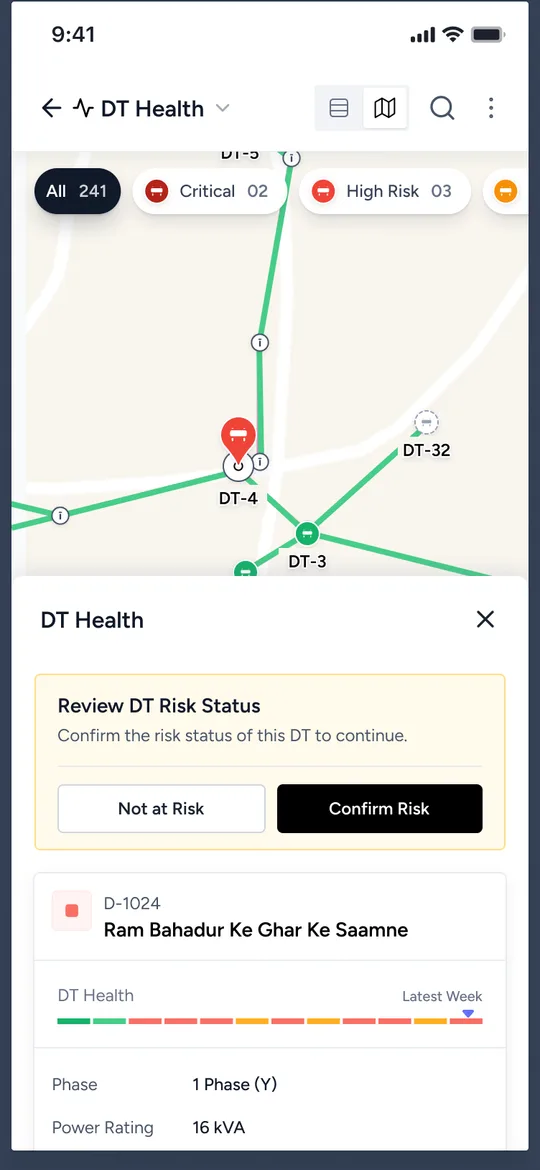
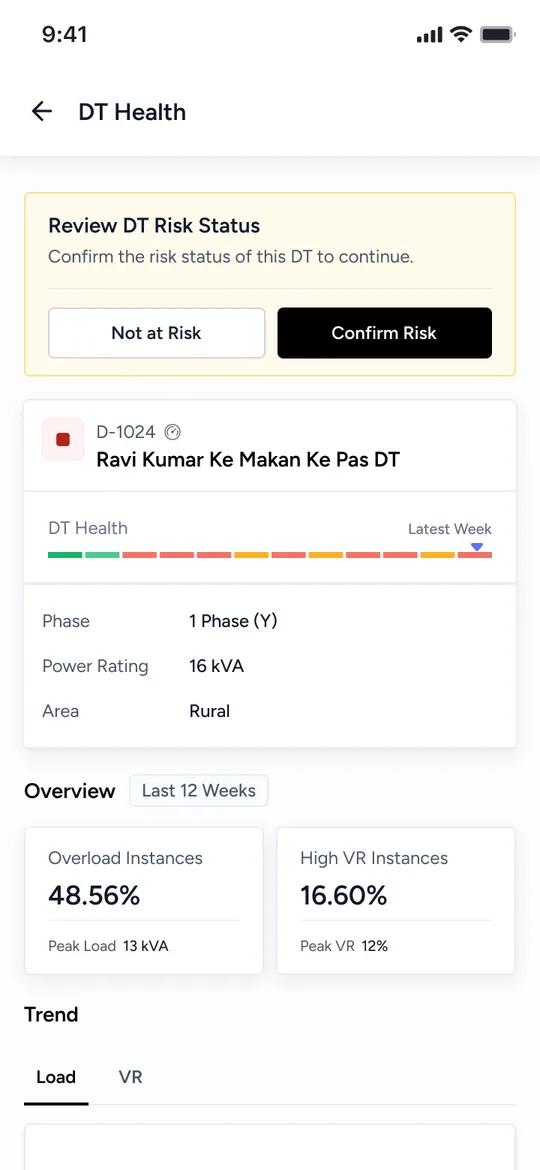
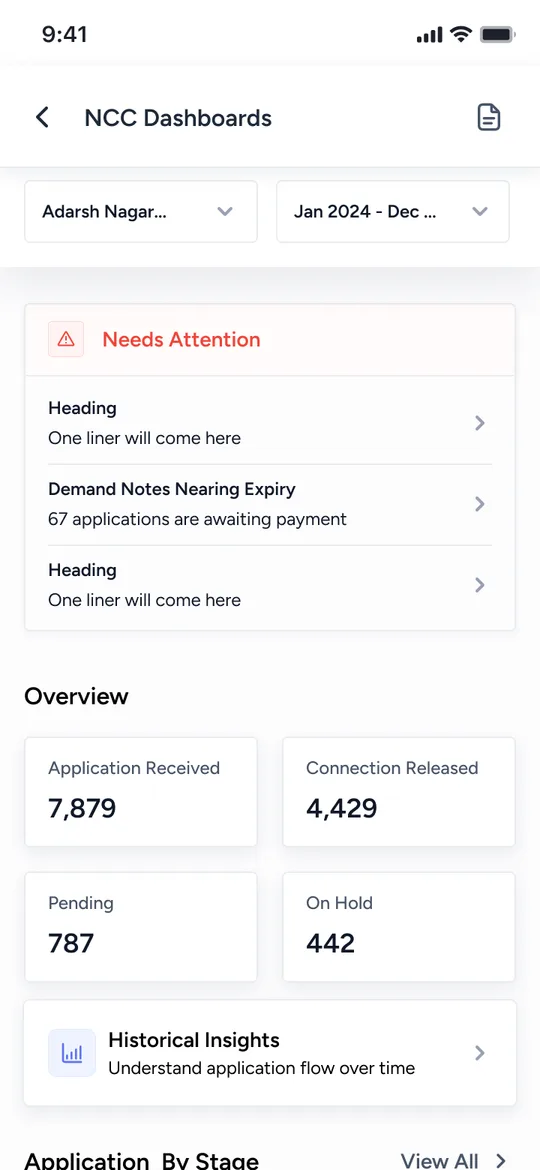
In use today
Electra is live with JVVNL in Rajasthan and BRPL in Delhi, used daily by thousands of staff. We trained AENs and linemen ourselves, and every session fed straight into the next release.
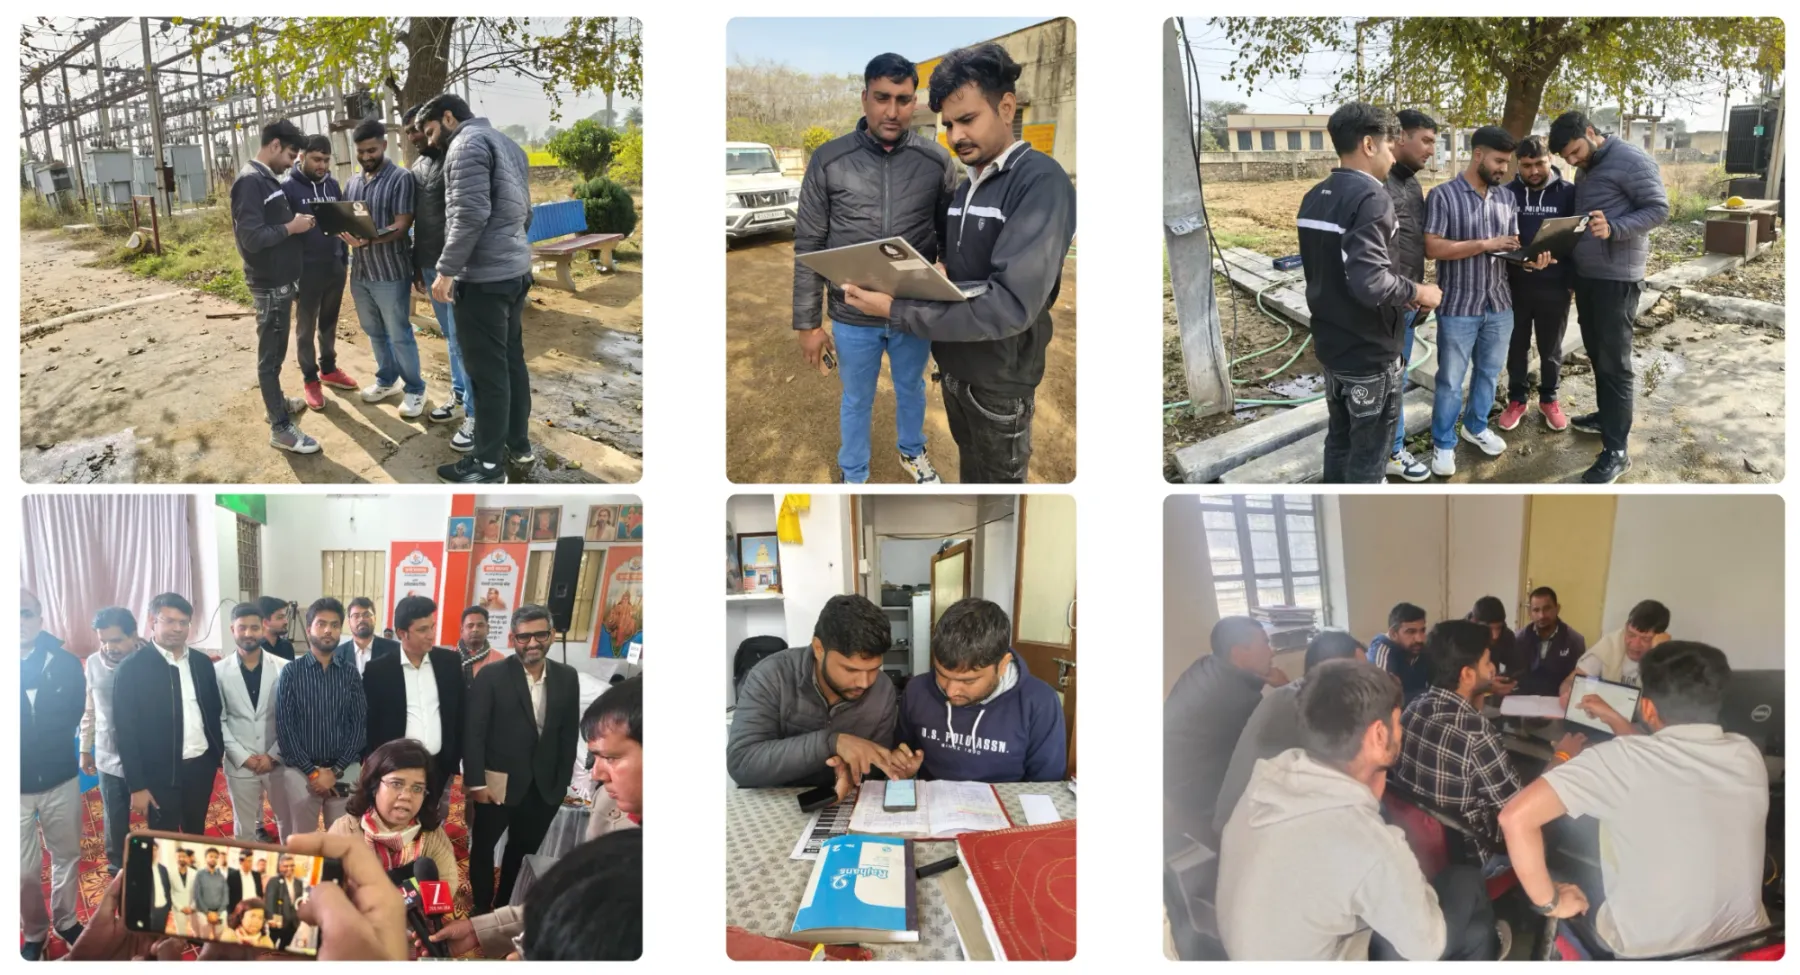
Training and feedback sessions with AENs and linemen, on site and in the office.
Grid assets mapped with the apps
Field staff and engineers trained
Utilities live, Rajasthan and Delhi
Map for every system
Impact in Kotputli
From April to December 2025 we mapped about 4 million high-tension and extra high-voltage assets in JVVNL. Since January 2026 the full software is live in Kotputli, the model circle. Electra estimates its yearly impact as follows.
AT&C losses traced to each feeder and transformer
Excess solar that can now be used locally
Transformer repairs avoided with failure heatmaps
Saved on power bought from the grid